Within Range
2007-2008
Excel 2007 brought in a feature called colour scales. It shades each cell by its value, so a sheet of numbers can be read at a glance: green for safe, red for risk, light for low, dark for high. It was designed to make data easier to read. In 2007 and 2008, spreadsheets like these held the world’s measurements, from mortgage books to satellite records of the planet.
Within Range uses the feature against itself. Each work is an Excel 2007 workbook of ordinary-looking figures, in default cells, with nothing drawn and nothing hidden. At 100% it’s a wall of numbers. Zoom out to 10% and the colour scale turns them into an image. Each sheet tab is a month. Every sheet was captured at 10% zoom and cropped to the image alone, with the menus and gridlines of Excel removed. The frames were then joined in Windows Movie Maker into a .wmv animation, so the months play in sequence and the change unfolds over time.
The work asks what spreadsheets show and what they let us look past. They use real figures from the period, so the images carry the weight of actual events, but they’re still built from data, shaped by the choices of whoever made the sheet.
Open Water
In September 2007, Arctic sea ice fell to 4.27 million square kilometres, 23% below the previous record. Open Water is twelve sheets, January to December 2007. Each cell holds a figure for how much of one patch of the Arctic is covered by ice, from 0 to 100. At 10% zoom, the sheets become the Arctic seen from above, white ice on dark water around grey land. Over the year, the ice spreads through winter, then pulls back towards the pole through the northern summer, to the record low in September, before starting to return.
Each month’s total ice extent matches the figure published by the National Snow and Ice Data Center. The shape of the ice within each month is modelled.
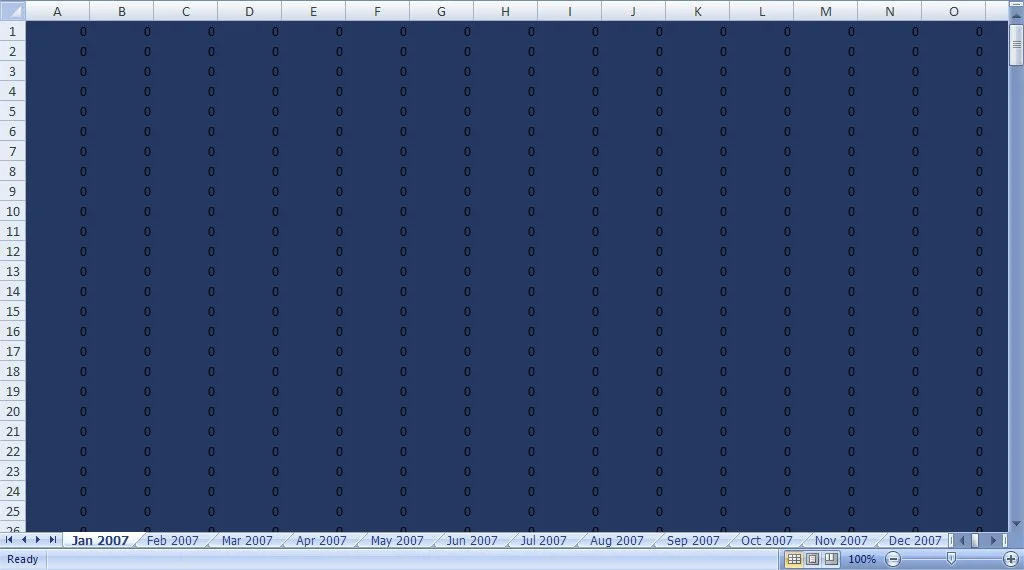
Open Water: January at 100%
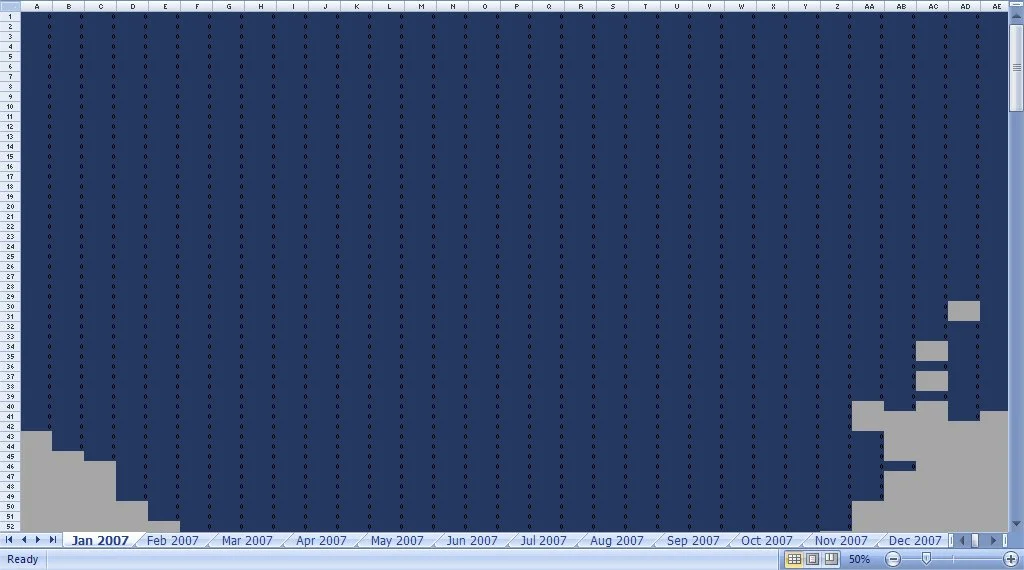
Open Water: January 50%
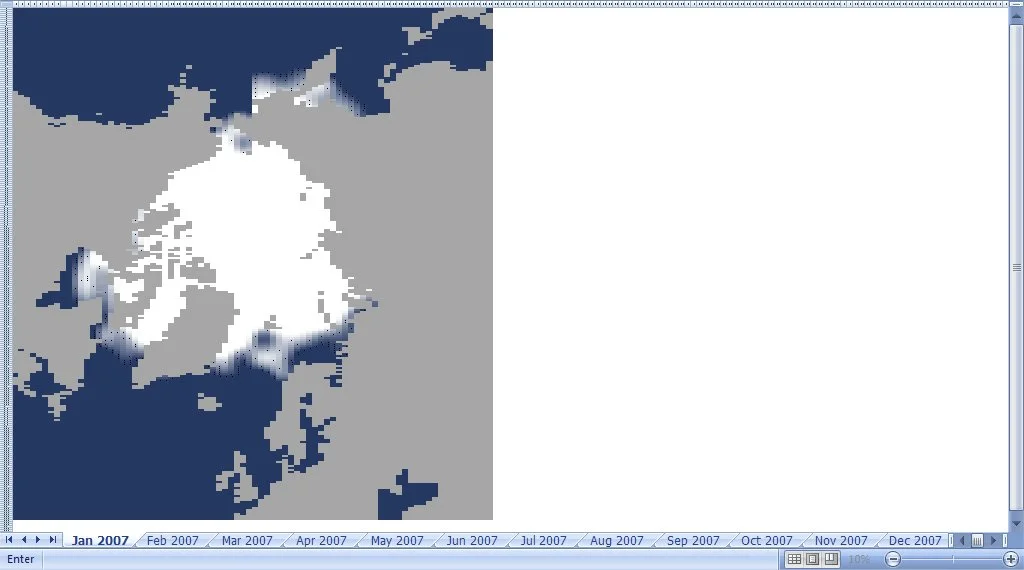
Open Water: January at 10%
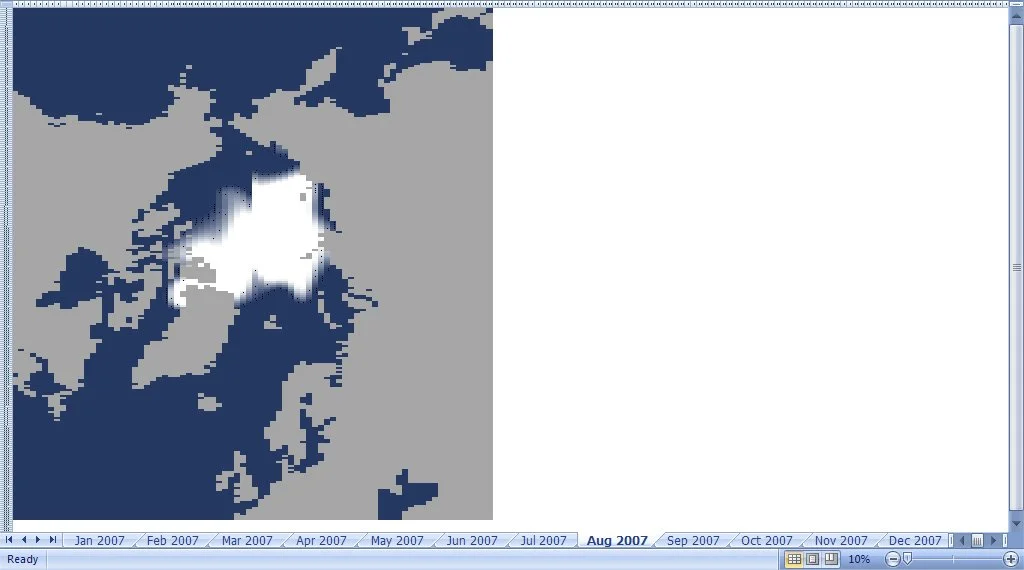
Open Water: August at 10%
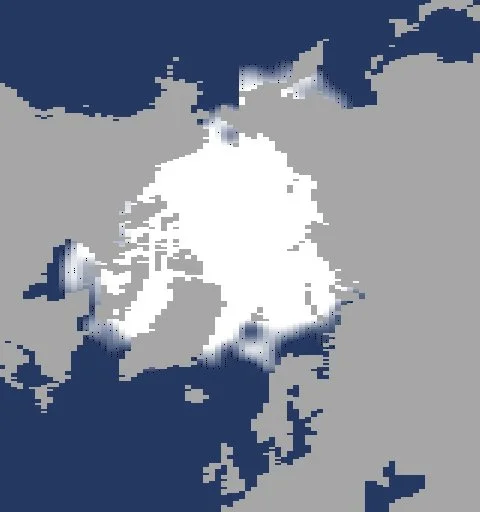
Open Water: January isolated
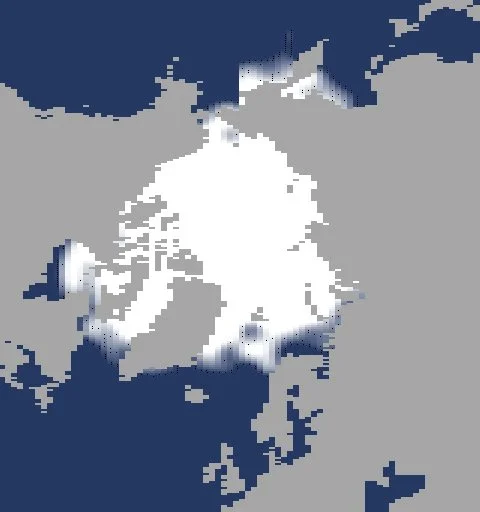
Open Water: February isolated
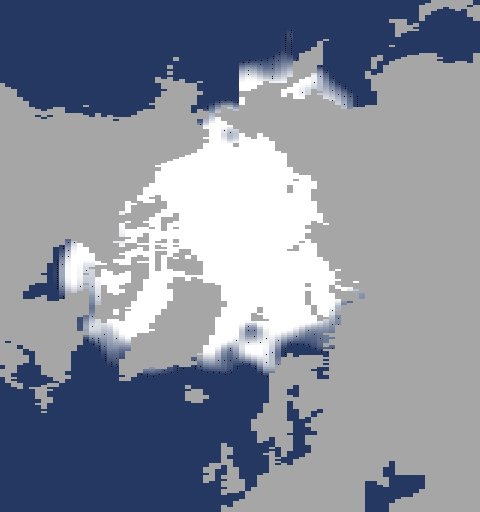
Open Water: March isolated
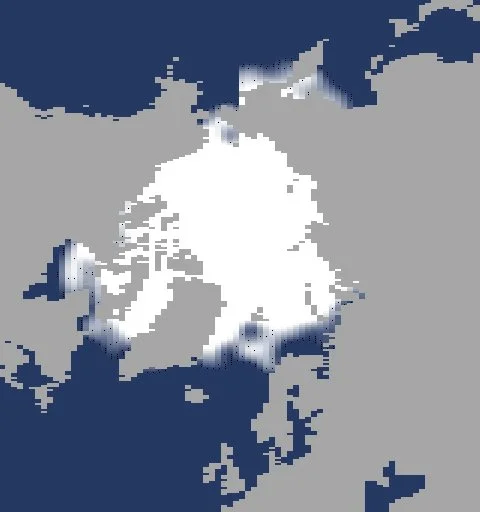
Open Water: April isolated
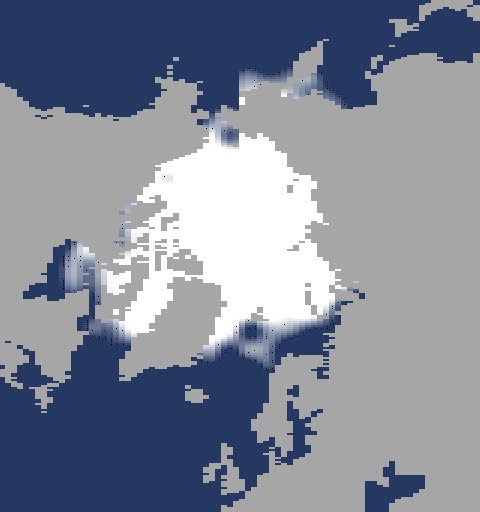
Open Water: May isolated
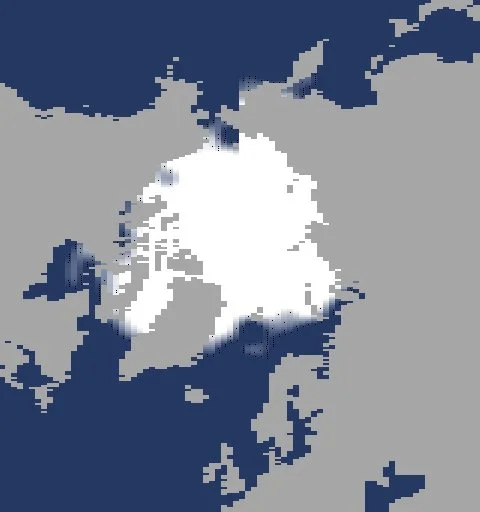
Open Water: June isolated
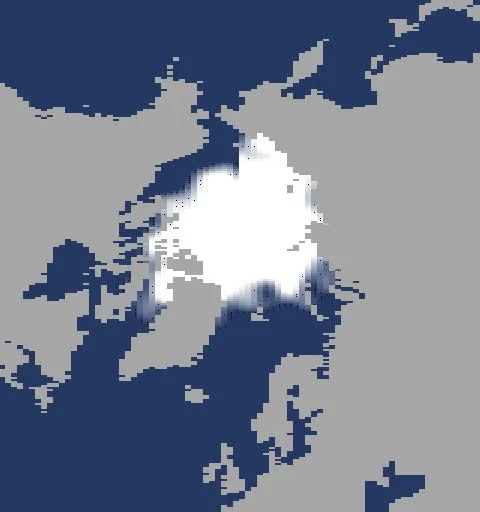
Open Water: July isolated
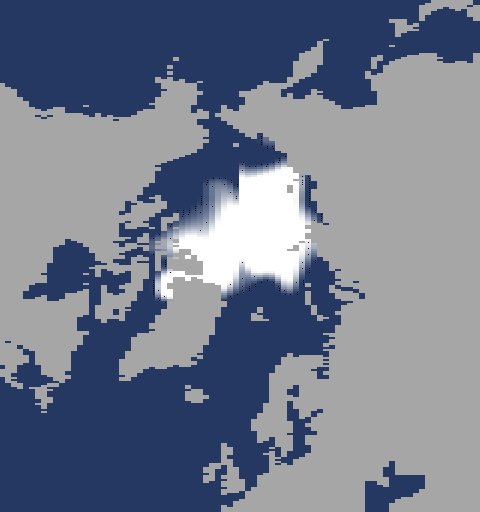
Open Water: August isolated
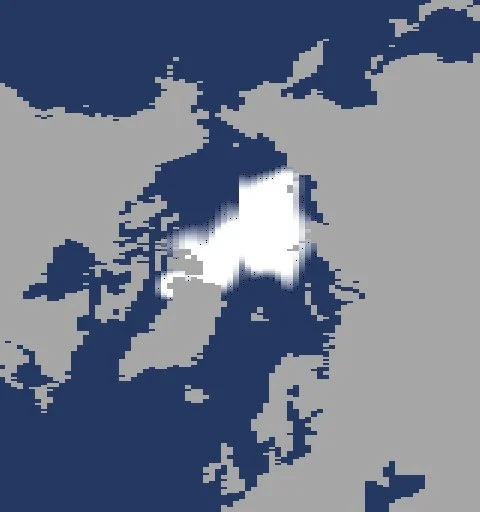
Open Water: September isolated
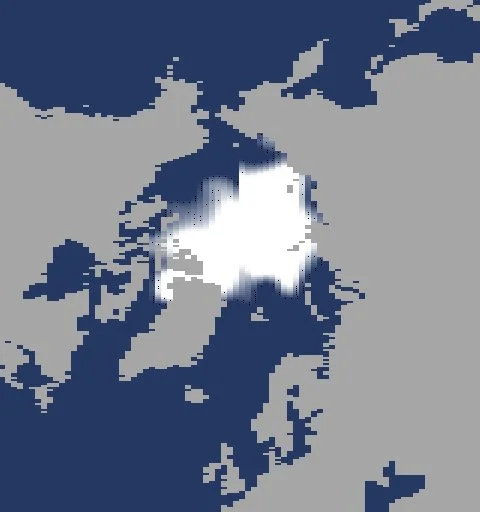
Open Water: October isolated
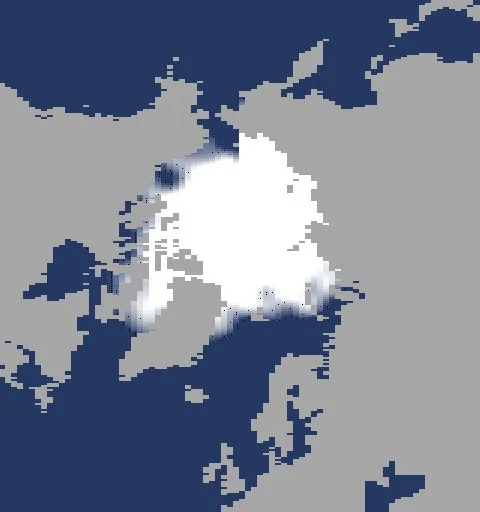
Open Water: November isolated
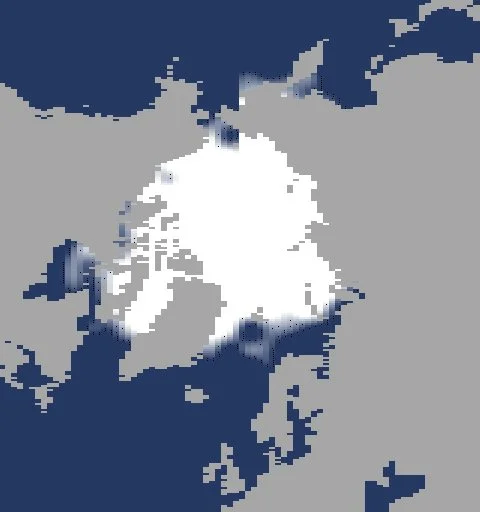
Open Water: December isolated
Fishbone
From 2004, Brazil’s space agency ran DETER, a satellite system that flagged new clearing in the Amazon every month. Fishbone is nine sheets, April to December 2008. Each cell holds a figure for forest cover, from 0 for cleared ground to 100 for full canopy. At 10% zoom, the sheets become a block of rainforest seen from above, with a road running through it and a river to one side. Month by month, clearings branch out from the road in the “fishbone” pattern familiar from satellite images of the period, and the frontier moves deeper into the forest.
The amount cleared each month follows DETER’s monthly alerts for the whole Brazilian Amazon, heavy in April and May, dropping in July, and tailing off by December. The place and the pattern of clearing are modelled. The spreadsheet does what the satellites did: it counts the forest, month by month, as it goes.
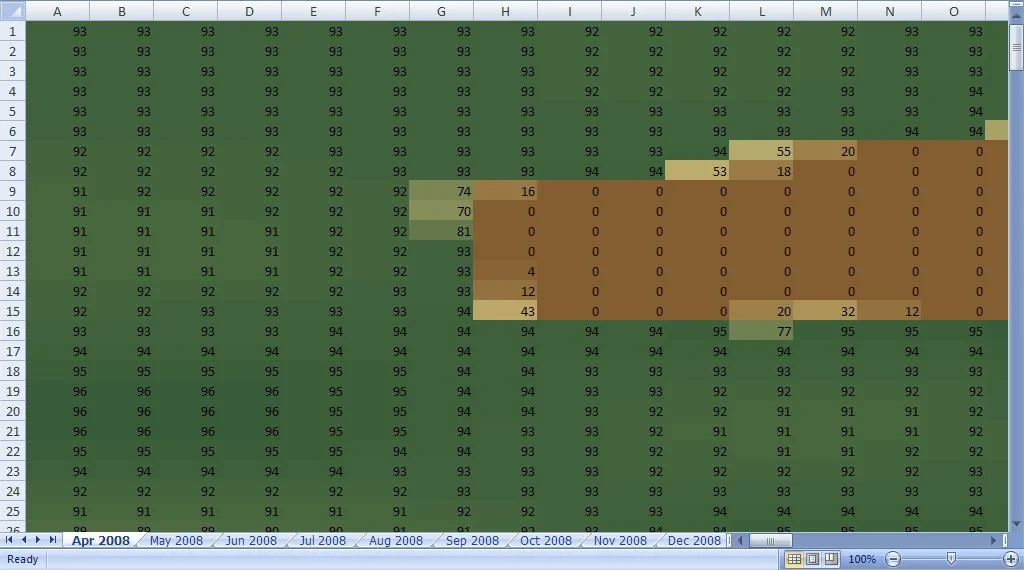
Fishbone: April at 100%
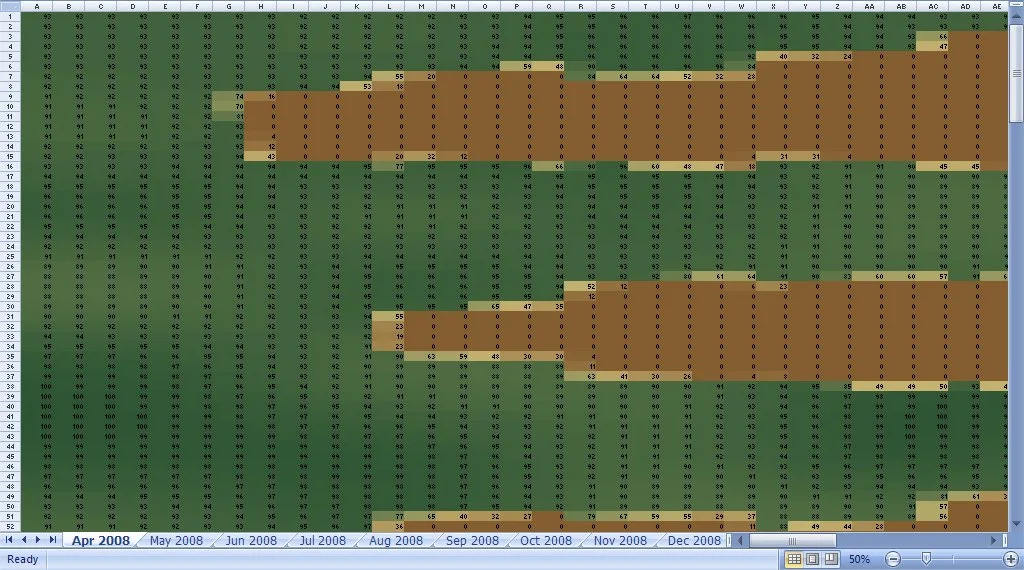
Fishbone: April at 50%
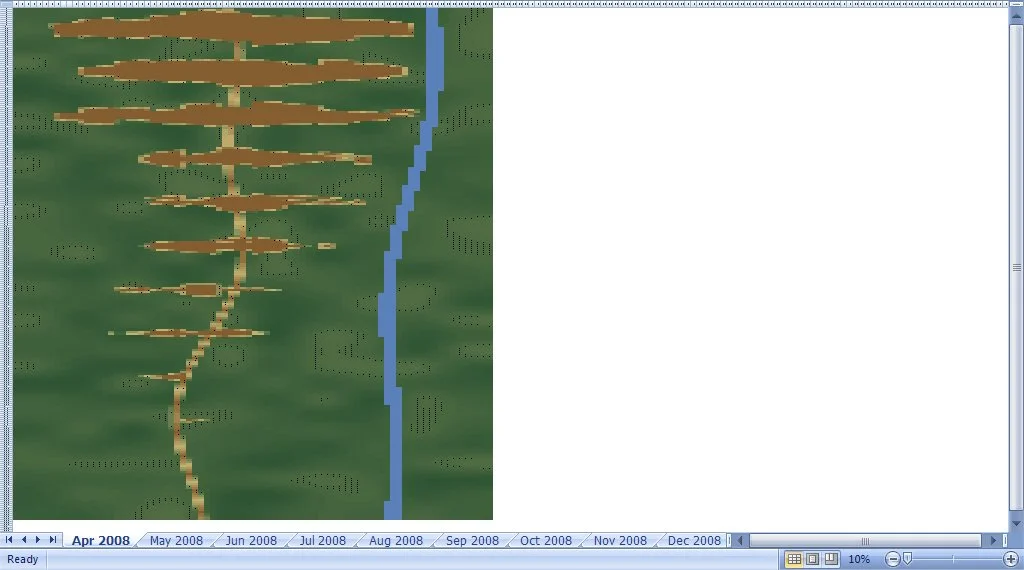
Fishbone: April at 10%
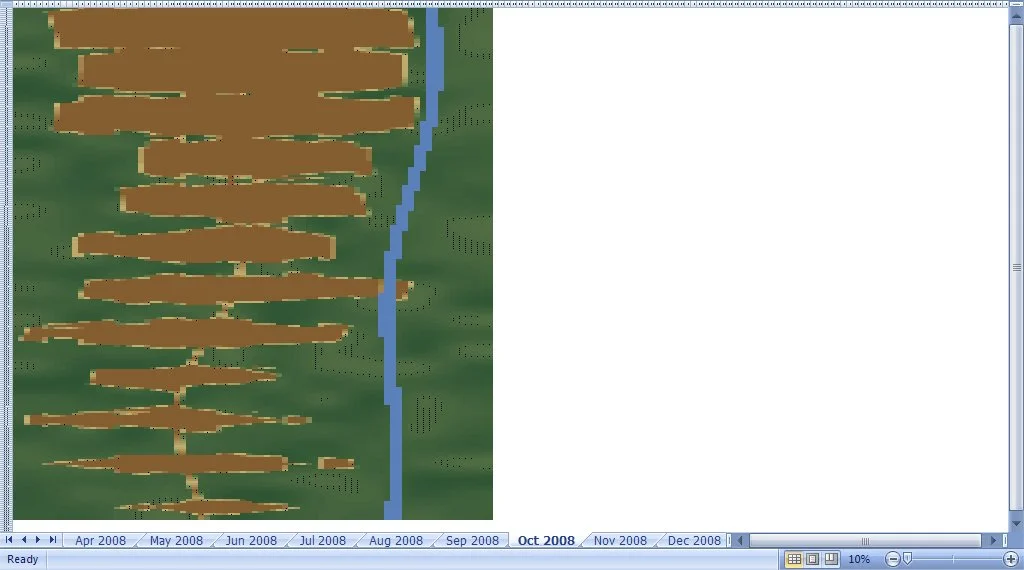
Fishbone: October at 10%
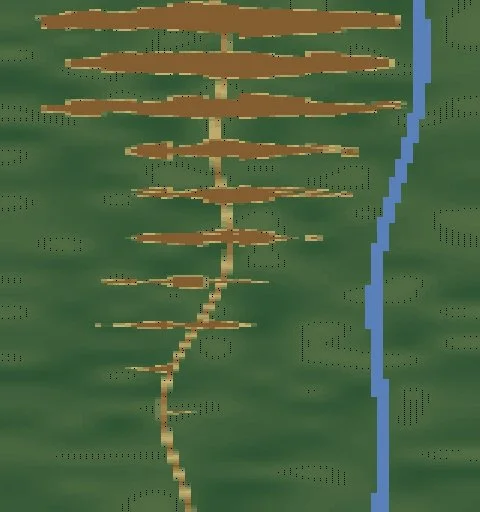
Fishbone: April isolated
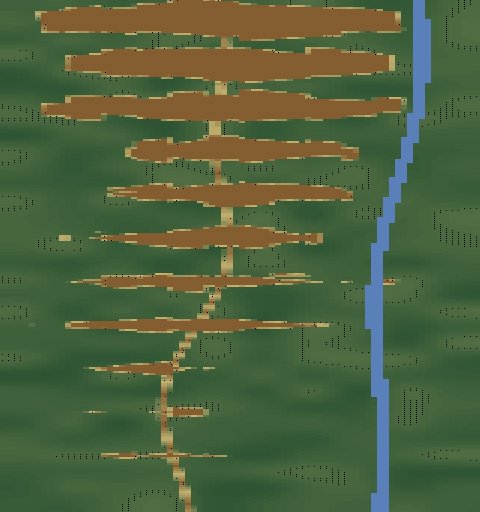
Fishbone: May isolated
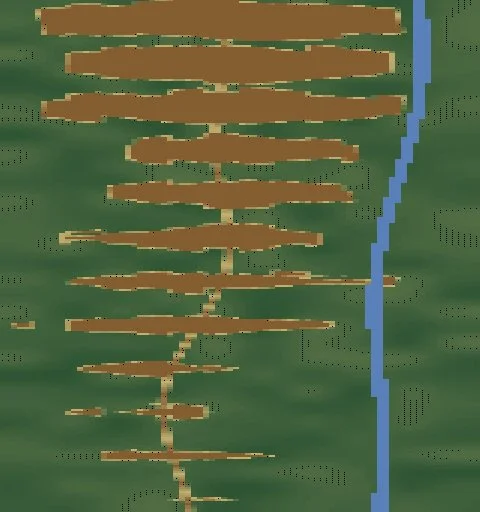
Fishbone: June isolated
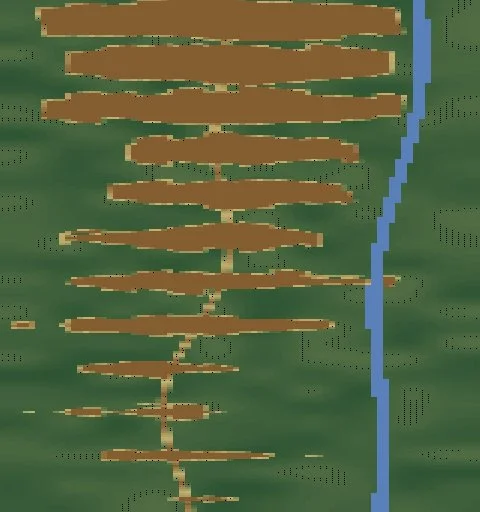
Fishbone: July isolated
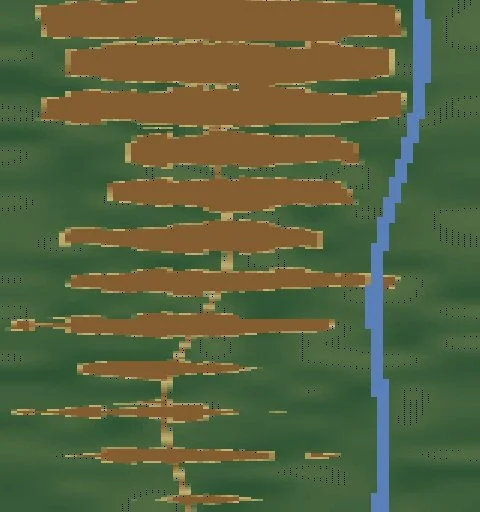
Fishbone: August isolated
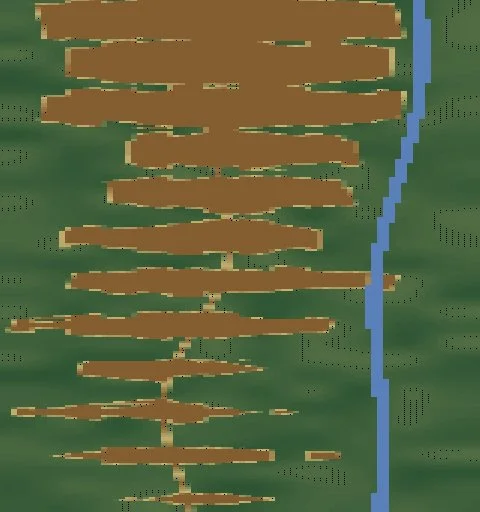
Fishbone: September isolated
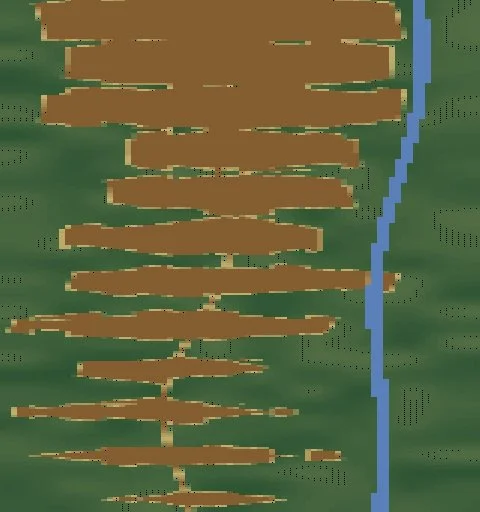
Fishbone: October isolated
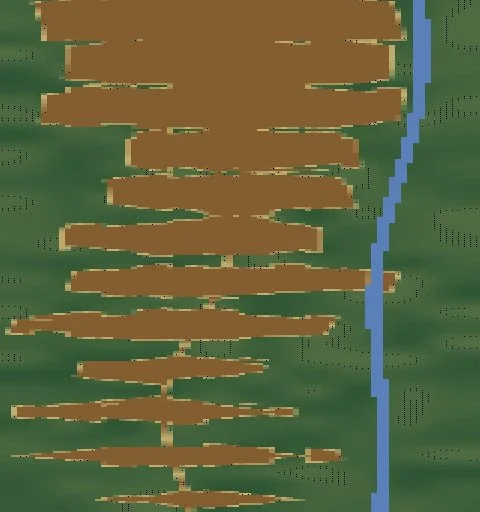
Fishbone: November isolated
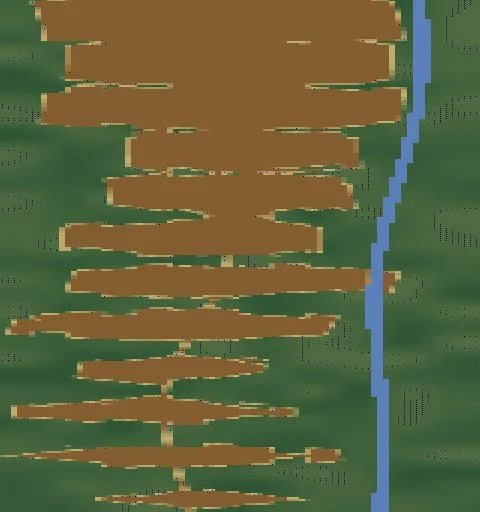
Fishbone: December isolated